As part of the Foundation’s commitment to transparency, each week it will publish data to help the NEAR community understand the health of the ecosystem. This will be on top of the quarterly reports, and the now monthly funding reports.
You can find the Quarterly Transparency Reports here. (The Q3 report will be published next week.)
Last week’s On-Chain Data Report can be found here.
The Importance of Transparency
Transparency has always been one of NEAR Foundation’s core beliefs. Openness to the community, investors, builders, and creators is one of the core tenets of being a Web3 project.
In recent months, in response to community frustration, the Foundation has endeavored to do more. This NEAR Weekly On-Chain Data Report is just one of the ways in which the Foundation is being more proactively transparent.
New Accounts and Active Accounts
New Accounts are defined as new wallets created on the NEAR blockchain. While there was a decline in new accounts between the last week of November and the first week of December, this figure rose from an average of 14,000 per day to approximately 24,000 per day this week. New accounts reached a weekly high of 25,001 on December 12th.
This puts last week’s New Accounts data in line with November’s average figure of 24,000 wallets per 24 hours. As noted last week, the peak for account creation in Q4 was September 13, during which 130,000 new wallets were created in a single day. Collectively, these numbers equate to nearly 2M total wallets on the NEAR blockchain.

The Daily Number of Active Accounts measures the number of NEAR wallets making on-chain transactions. Over the last week, Active Accounts hit a high of 92,440 before trending down to about 51,000 per day.
Historically, there have been highs of more than 100,000 active accounts on NEAR. The high for Active Accounts on any one day in Q4 of 2022 was logged on September 14, during which 183,000 accounts were active.

New Contracts and Active Contracts
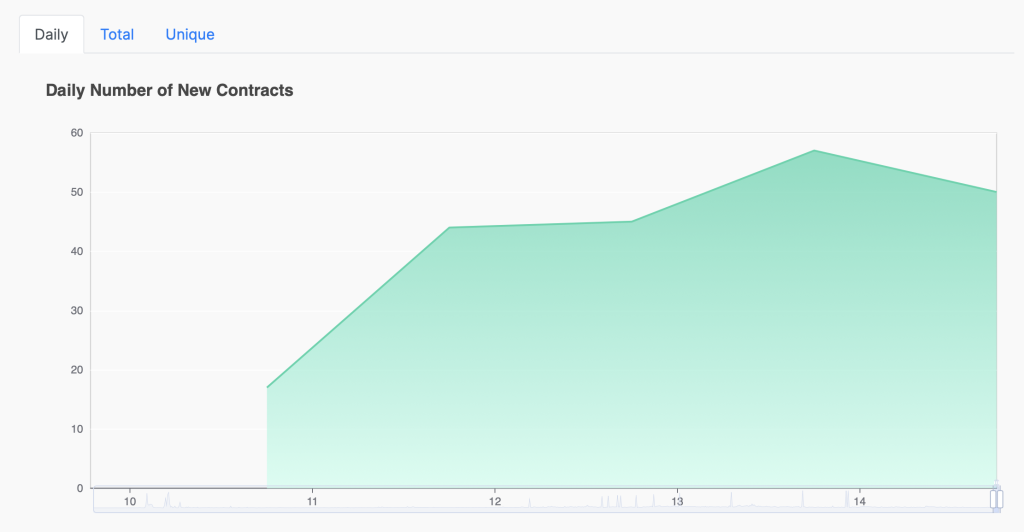
Smart contracts created on NEAR are programs stored on a blockchain that run when predetermined conditions are met. The Daily Number of New Contracts is valuable as a metric because it gives the community a way of measuring the NEAR ecosystem’s health and growth. If there are more active contracts, it follows that projects are more actively engaging with the NEAR protocol.
This week, the daily number of New Contract has been trending upward, whereas last week it rose and fell. A low of 17 New Contracts was measured on December 11th,, before falling to 50 on the 14th. A weekly high of 57 contracts were created on December 13th.
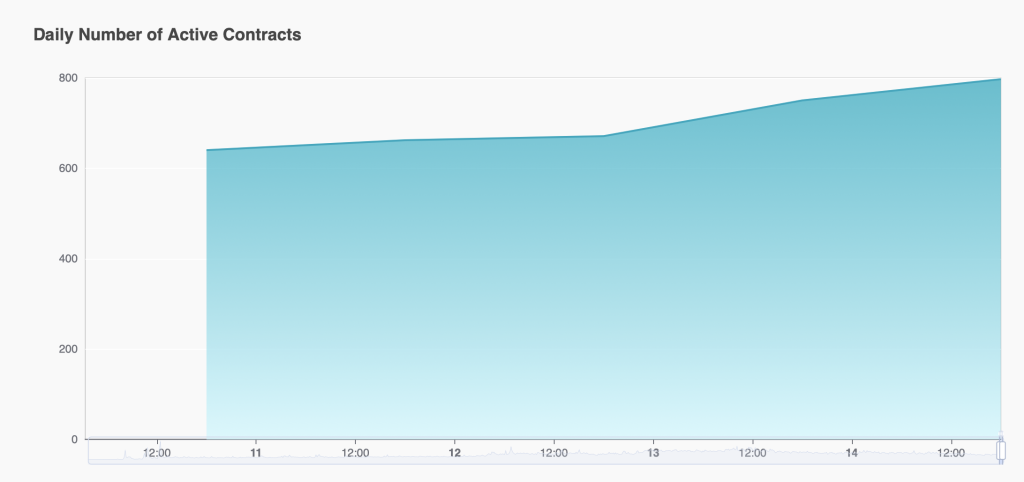
Active Contracts measure contracts executed during a 24-hour period. This metric also trended upward this week, with 640 measured on December 11th and and a high of 797 Active Contracts created on December 13th.
Used Gas and Gas Fee
Gas Fees is a term used to describe the cost of making transactions on the NEAR network. These fees are paid to validators for the network services they provide to the NEAR blockchain. Gas fees incentivize validators to secure the network.
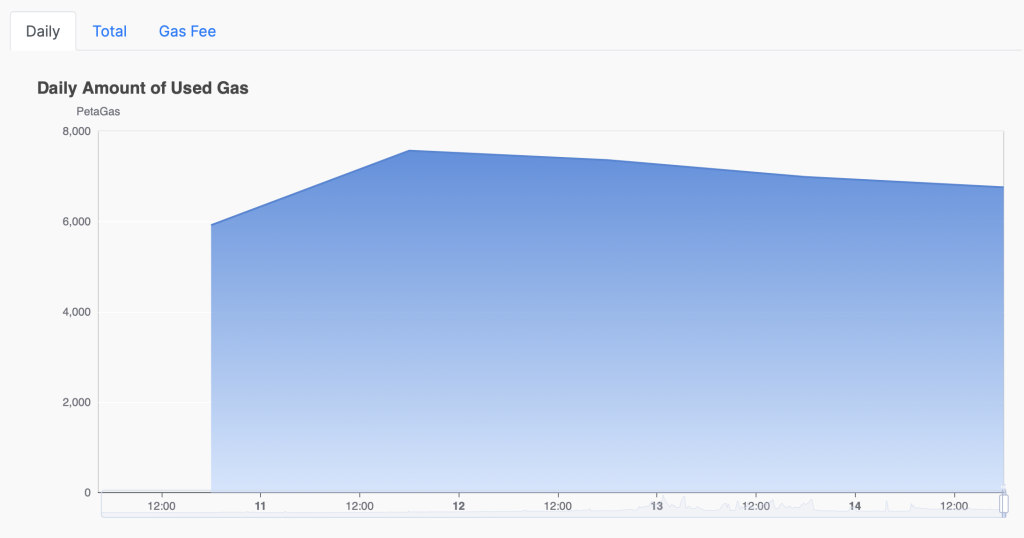
In the last week, Used Gas on NEAR (PetaGas) was measured at a high of 7,569 on December 11th and 6,758 on the 14th. To learn more about Gas on NEAR, check out the NEAR White Paper. (Rises in gas used can be attributed to many factors, with a common one being increased user activity on the NEAR network.)
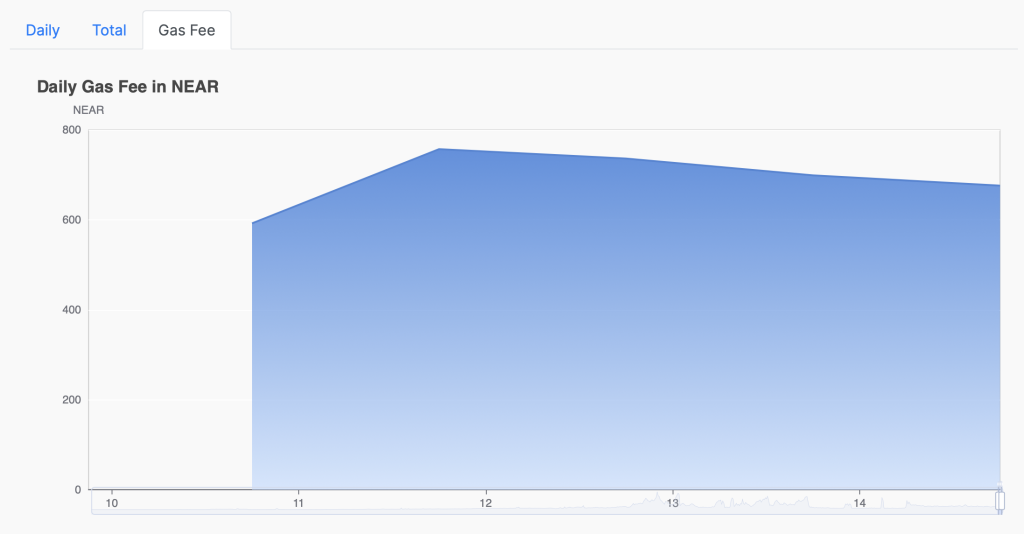
Over the last week, there has been a slight drop in the Gas Fee (in NEAR), which correlates with a drop in Used Gas. On December 11th, the Gas Fee was measured at 756, before falling to 675 on the 14th.
Daily Transactions
The Daily Number of Transactions illustrates the number of times the blockchain logged a transaction. The data from this week showcases an increase in the number of transactions, which was also the case over the previous week. Daily Number of Transactions hit a weekly high of 439,660 on December 11th before falling to 373,335 on the 14th.
As part of the Foundation’s commitment to transparency, each week it will publish data to help the NEAR community understand the health of the ecosystem. This will be on top of the quarterly reports, and the now monthly funding reports.
You can find the quarterly reports here.
You can find monthly reports on funding here.
Last week’s transparency report can be found here.
The importance of transparency
The NEAR Foundation has always held transparency as one of its core beliefs. Being open to the community, investors, builders and creators is one of the core tenets of being a Web3 project. But it’s become apparent the Foundation needs to do more.
The Foundation hears the frustration from the community, and it wants to be more pro-active in when and how it communicates.
New Accounts and Active Accounts
New Accounts are new wallets being created on the NEAR blockchain. In the last days of November and the first days of December, the daily number of new accounts had been declining. This week however, activity has been trending up, with the average number of new accounts averaging 14,000 per day, with a weekly peak of 14,752 recorded on December 6.
This is down on November’s figure of 24,000 wallets per 24 hours, on average. These numbers are conducive with the overall decline in sentiment around blockchain.
Looking more broadly, the peak for account creation in Q4 was September 13 where 130,000 new wallets were created in one day. Collectively, these numbers equate to 22,551,000 total wallets on the NEAR blockchain.

The Daily Number of Active Accounts is a measure of how many wallets on NEAR are making transactions on chain. Over the last week, the number of daily active accounts has oscillated between a a low of 12,639 on December 5, to a peak of 14,752 on December 6.
Historically, this is a decline from highs of more than 100,000 active accounts on the network. The highest number of active accounts on any one day in Q4 this year was logged on September 14, where 183,000 accounts were active.

New Contracts and Active Contracts
Contracts on NEAR are simply programs stored on a blockchain that run when predetermined conditions are met. The Daily Number of New Contracts is a valuable metric for understanding the health and growth of an ecosystem.
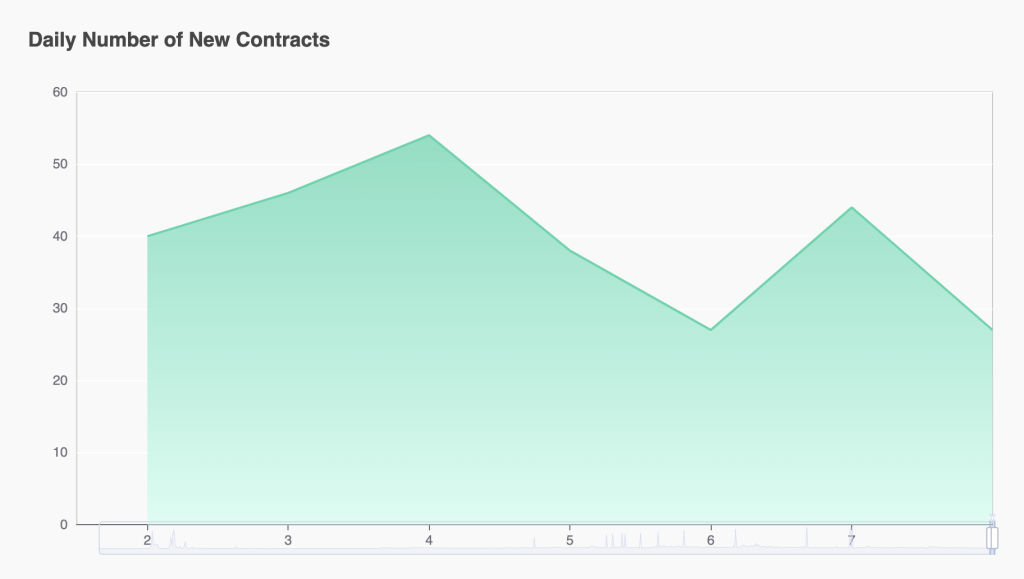
The more active contracts there are, the more projects are actively engaging with the NEAR protocol. The chart below shows a cyclical rhythm to new contracts, with rises and falls. Over the last seven days, the number of new contracts reached a daily high of 54 on December 4, and a weekly low of 27 on December 6. This range is broader compared to the week before, with last week’s highest number of 44 on November 30, to a low of 12 new contracts on November 27.
Active contracts is a measure of contracts that execute in a 24 hour period. This number has remained consistent throughout the last week with an average of more than 600 active contracts on the NEAR network. Taking a historical perspective on these numbers, the average has declined in Q4, with previous highs in active contract activity coming in the third week of September 2022.

Used Gas and Gas Fee
Gas Fees are a catch all term for the cost of making transactions on the NEAR network. These fees are paid to validators for their services to the blockchain. Without these fees, there would be no incentive for anyone to keep the network secure.
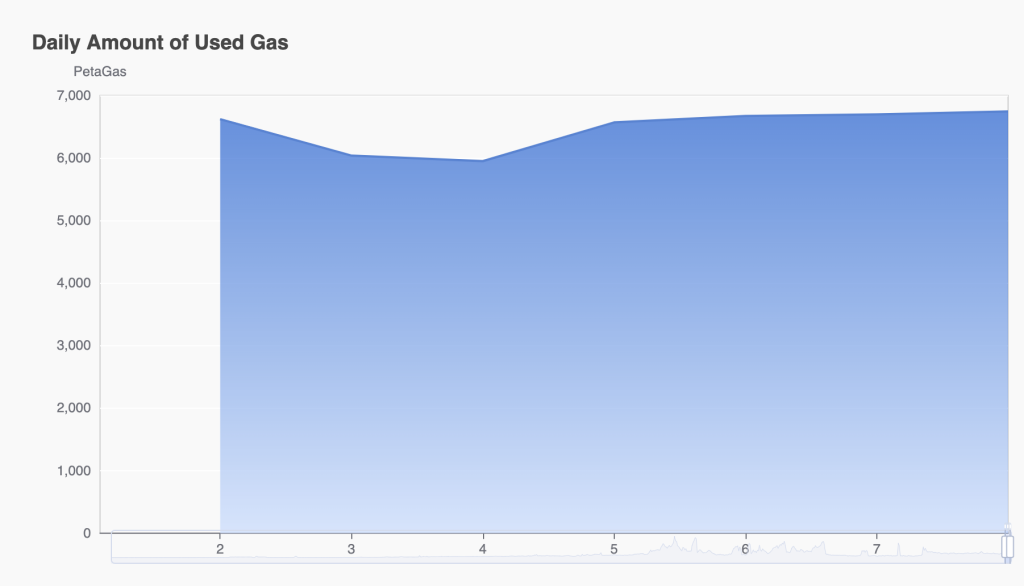
Over the last week, the daily amount of gas, expressed here as PetaGas, which is the equivalent of 0.1 $NEAR, has maintained a fairly consistent value between 5,949 PetaGas and 6,743 PetaGas. To learn more about Gas on NEAR, there is an excellent explainer in the NEAR White Paper. Compared with last week, the Daily Amount of Used Gas has decreased, from highs of more than 8,000 PetaGas.
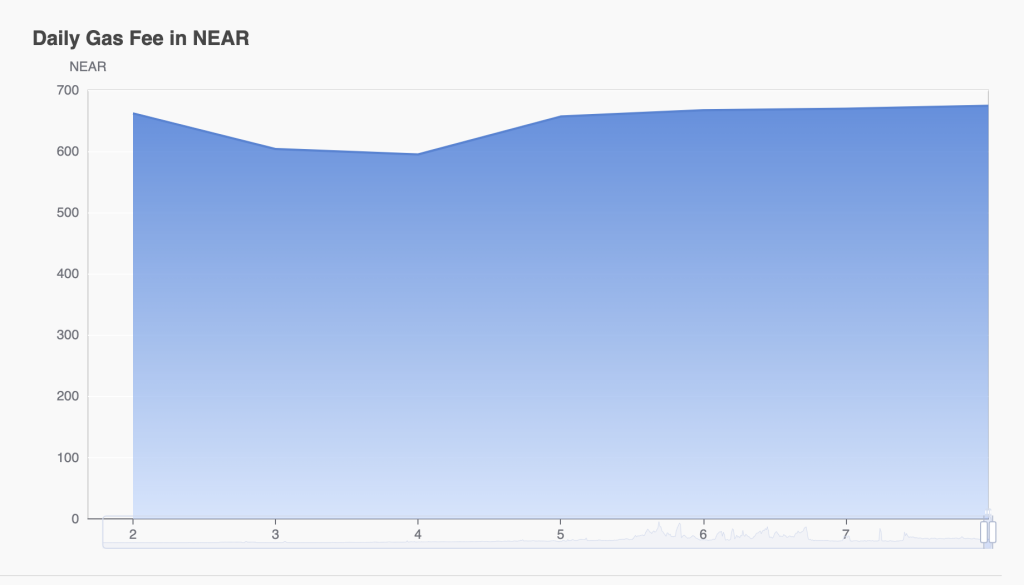
The Daily Amount of Gas correlates with the Daily Gas Fee used on the network. Over the last week, there has been an uptick in the amount of Gas used, which can be brought on by a number of different factors. One of the most common is increased activity among users of the network.
Daily Transactions
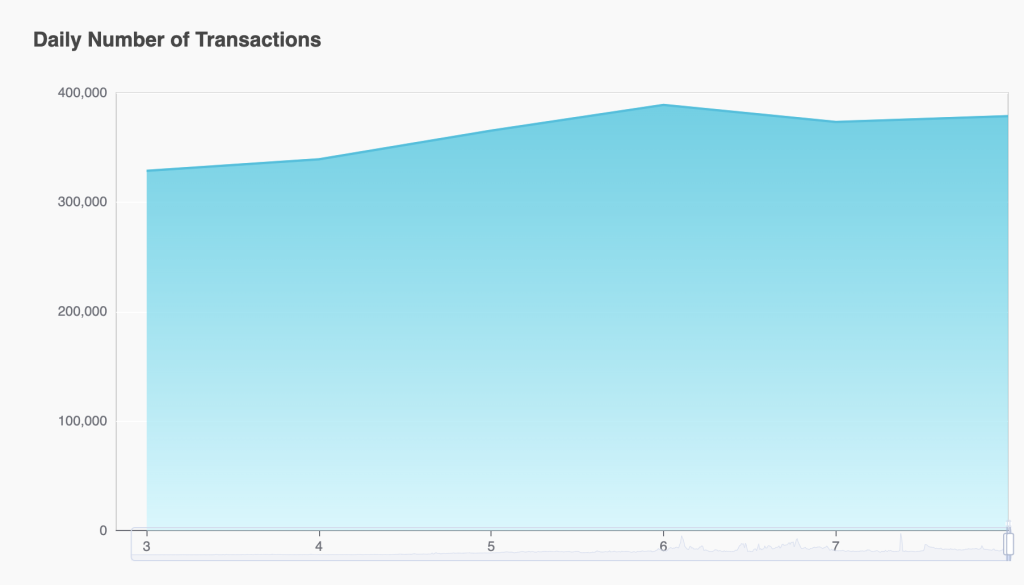
The daily number of transactions is a record of how many times the blockchain logged a transaction. This week’s data represents a healthy increase in the number of transactions. From lows of 328,000 transactions on December 3, to a weekly high of 388,000 transactions per day on December 6. Looking more broadly, NEAR transaction activity has been trending downwards in Q4, reflecting other on chain data presented here.
These reports will be generated each week and published on Friday.